What is Process Mapping in Lean Six Sigma?
→ Process Mapping is the graphical representation of the process.
→ It is used to describe the flow of material or information.
→ Sometimes it is also used as a Business Process Mapping.
→ Process Mapping is a very famous Management and Planning Tool that is mostly used in the Lean Six Sigma Projects
→ It helps to understand the process and process-related things like delay times, processing time, lead time, takt time, cycle time, process owner, the scope of the processes, responsibilities, etc.
→ This method is also used for various improvement projects like productivity improvement, efficiency improvement, loss reduction, quality improvement, etc
→ It helps us to gain a better understanding of the process and train new members effectively and efficiently.
→ The main components of process mapping are input, output, and process steps.
→ Process_Mapping is used in almost all business processes in the organization like Production, Manufacturing, Supply Chain, Sales, Marketing, Quality, Maintenance, etc.
Types of Process Mapping
→ There are different types of process mapping are explained below that are very widely used in the Lean Six Sigma Projects.
→ Basically, process mapping is all about communicating your process to others.
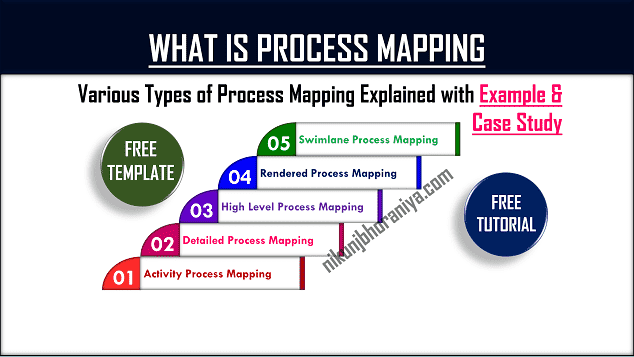
→ The most common process map types are mentioned below:
- Activity Process_Map
- Detailed Process_Map
- High-Level Process_Map
- Rendered Process_Map
- Swimlane (or Cross-functional) Process_Map
(1) Activity Process_Map:
→ The Activity Process_Map represents value-added and non-value-added activities in a process.
→ Also, we can understand this mapping as the VA and NVA (Value added and Non-Value added activities) Mapping of the process.
→ This is a very common mapping during the Lean Manufacturing and Lean Management project implementation in the organization.
(2) Detailed Process_Map
→ The Detailed Process_Map provides a much more detailed look at each step in the process.
→ This method is very helpful for a detailed understanding of any process and training others.
(3) High-Level Process_Map
→ The High-Level Process_Map is a representation of a process involving interactions between Supplier, Input, Process, Output, and Customer.
→ This method is very commonly known as the SIPOC Process_Mapping.
→ The SIPOC Process_Mapping is a very common method for the Six Sigma Project.
→ Also, visit: The SIPOC Diagram Process_Mapping Tool Explained with Example and Case Study with Editable Excel and PowerPoint Templates
(4) Rendered Process_Map
→ The Rendered Process Map represents current state and/or future state processes to show areas for improvement.
→ We can use this type of process map in Value Stream Mapping during the improvement projects.
→ Also, visit: Value Stream Mapping (Process_Mapping Tool) Explained with Example and Case Study
(5) Swimlane (or Cross-functional) Process_Map
→ The Swimlane Mapp separates out the sub-process and responsibilities in the process.
→ We can easily understand this type as a simple process flow chart with processes, sub-processes, and responsibilities.
→ So the Process Flow Chart is a Swimlane or Cross-Function type of Process Mapping.
→ Also, visit: Process Flow Chart (Process_Mapping Tool) Explained with Example and Case Study
Benefits of Process Mapping
→ Identify the wasteful activities and bottlenecks in the process
→ We can easily understand the process with the help of this tool
→ Help to train other members
→ Improve the Quality of product, process, or service
→ It also helps to manage the risk and contingency planning
→ Used in almost all improvement projects
→ Improve the efficiency
→ Identify the improvement opportunities
→ It helps us with problem-solving and decision making


Great Sir, Many concept clear because of you.
ReplyDeleteThank you very much and happy learning!!!
DeleteNice
ReplyDeleteThanks!!!
DeleteExcellent knowladge is being provided by you sir..
ReplyDeleteThank you for your kind words!!!
DeleteIts superb sir
ReplyDeleteThank you!!
DeleteExcellent sir ji
ReplyDeleteThanks for your kind words!!!
DeletePost a Comment