What is Matrix Data Analysis Diagram?
→ The Matrix Data Analysis Chart (MDAC) is used to identify the relationships of related group items in a larger group of data_sets.
→ Sometimes this diagram is known as MDAC.
→ This tool is one of the most important tools of 7 Management and Planning Tools (New 7 QC Tools).
→ The MDAC is mostly used to perform market research and describe products and services.
→ Matrix_Data is arranged for easy visualization and comparisons.
→ The MDAC helps classify items by identifying two major characteristics common to all items and then plotting each item as a point on a standard x-y chart.
→ This makes it easier to see how the individual items relate both to the characteristics and to one another.
→ The basic Matrix Data Analysis Chart is mentioned in the below picture. We can easily understand the analysis of the matrix diagram.
→ We can take the decision based on the different characteristics scoring matrix falls in which quadrant.
➨ The quadrant wise the analysis as mentioned below.
→ (1) 1st Quadrant is known as Desirable Quadrant
→ (2) 2nd Quadrant is known as Partially Desirable Quadrant
→ (3) 3rd Quadrant is known as Non-Desirable Quadrant
→ (4) 4th Quadrant is known as Partially Desirable Quadrant
When to use Matrix Data Analysis Chart
→ We can use this tool when investigating factors that affect the number of different items, to determine common relationships.
→ This tool is used to check that similar items have effects of similar factors or having the effects of different factors also.
→ Matrix Data Analysis Diagram is also used as the Problem Solving Tool.
→ When comparing a large set of items, the complexity of the situation can make it difficult to determine how different factors relate to one another at this instance we can use this tool.
→ This tool is useful to find a group of items that behave in similar ways or not.
How to Create a Matrix Data Analysis Chart (MDAC)?
→ The Four steps for creating an MDAC diagram are mentioned below.
- Decide the Two Characteristics for Analyse
- Assign the Scoring to Characteristics and Prepare the Matrix
- Put all_data into the X-Y type Graph.
- Give the suitable title to the Graph and Analyze the graph based on Quadrant
→ For a better understanding of the Matrix Data Analysis Chart (MDAC), we are taking the below example.
Example of Matrix Data Analysis Diagram
→ We need to analyze the different dishes in the college canteen. So we will follow the above-mentioned steps for that.
Step 01: Decide the Two Characteristics for Analyse
→ We will compare the different dishes of the college canteen based on the below two-parameter (Characteristics).
→ (1) Visual Attractiveness of Dishes, and
→ (2) Taste of Dishes
→ Now we will take these dishes for analysis Chilly Potato, Masala Dosa, Papdi Chat, Macaroni, Lunch/Dinner, Sandwich, Grilled Sandwich, and Samosa.
Step 02: Assign the Scoring to Characteristics and Prepare the Matrix
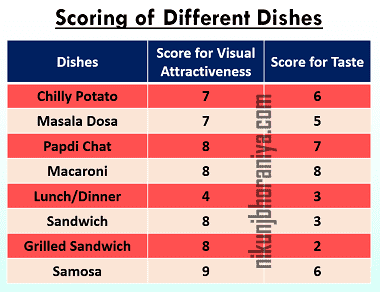
→ So we will consider the score based on the student's rating of all dishes of the college canteen on a scale of 1 to 10.
→ Score 1 stands for very poor and scores 10 stands for very good.
→ So refer to the below table for scoring given by the students.
Step 03: Put all data into the X-Y type Graph
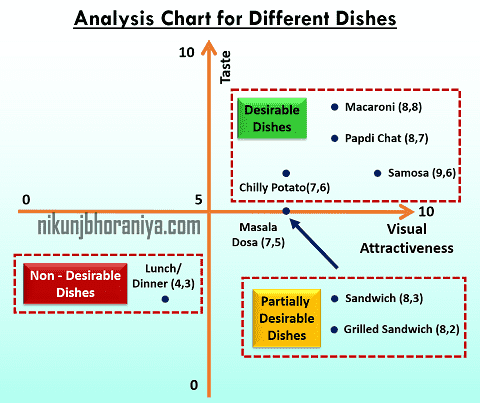
→ From the above table, all_data points are then plotted on a simple x-y graph.
→ The X and Y both axis is shown from the 0 to 10 scoring.
→ Refer to the below picture for the planting of the graph.
Step 04: Give the suitable title to the Graph and Analyze the graph based on Quadrant
→ Now the finally we need to analyze the graph based on the quadrant of data falling.
→ So based on the quadrant and matrix data_types we can get the below results for different dishes by comparing and scoring of different two parameters such as (1) Visual Attractiveness of Dishes, and (2) Taste of Dishes.
➨ The Desirable dishes are: Macaroni, Papdi Chat, Samosa, and Chilly Potato
➨ The Partially Desirable dishes are: Masala Dosa, Sandwich, and Grilled Sandwich
➨ The Non Desirable dishes are: Lunch/Dinner
Other Examples of MDAC Diagram Analysis
→ A Manufacturing Company is looking to develop alternative materials to build a more durable gearbox by comparing the material cost and material's durability.
→ A Manufacturing facility is looking to develop an alternative vendor for raw material for less cost and on-time delivery for the same material property.


So, where are the prepared excel templates to do the analysis that you describe? I want to check your methods, using the same tools. Thanks
ReplyDeleteThe method is described in 4 easy steps so you can easily understand it with the help of this tutorial.
DeleteGreeat reading your post
ReplyDeleteThanks and Happy Learning!!!
DeleteGreat learning experience!
ReplyDeleteThanks and happy learning
Deleteunni
ReplyDeleteYes Thanks
DeletePost a Comment